Bond Strategy Update December 2015
Prologue
The latest production of “Waiting for Godot” is in full swing with U.S. Federal Reserve (“Fed”) Chair, Janet Yellen in the title role. After failing to pull the trigger on several past occasions, members of the FOMC (Federal Reserve Open Market Committee), led by Chair Janet Yellen, are again setting up the financial markets to expect a hike in the Federal funds rate, this time in the December 15/16 FOMC meeting.
The intention is well-justified from an academic standpoint. The current “Zero interest rate policy” is an emergency measure and the U.S. economy is no longer in a state of emergency. Various members of the FOMC, including Chair Yellen, and some members of Congress, have been arguing for a return to “Rule-based” monetary policy. The rule in question is the (John) Taylor Rule, which defines where Fed funds (overnight money leant to commercial banks) should be given a set of prevailing economic data.
There is always, of course, the practical aspect. Given the dual mandate of price stability and full employment, the Fed is wary of causing market turmoil or triggering an economic slowdown.
This is where “data dependent” comes in. Since the FOMC cannot make up its mind, it is convenient to pass the puck to the data department. If the economy is strong enough and if inflation is close to healthy, the FOMC will raise interest rates. Otherwise, it will wait.
The result is that financial markets are now conditioned by the FOMC to follow employment data to gauge the Fed’s next move.
Regrettably, employment is a lagging indicator.
Perhaps more importantly, the Fed does not operate in a vacuum. The last time this tragicomedy was staged, the Fed backed off from raising rates due to market turmoil caused by the devaluation of the Chinese Yuan on August 11, 2015.
Interestingly, if you wait long enough, another Yuan devaluation might show up…
Macroeconomic Update
Economic data of a leading nature have been turning weaker, even when U.S. employment statistics are showing some strength. Inventories have been piling up in the third quarter, putting a drag on growth potential in the fourth quarter. The strong U.S. dollar (in part a function of the Fed’s intention to raise interest rates) is having a negative impact on manufacturing, which, according to the latest survey, is in contraction mode. Despite its 15% weight in the economy, manufacturing jobs are better paid and they are the source of demand that will trickle down to the service sectors. Corporate profits fell again in the third quarter. Business capital spending did recover in October, but only after a long series of declines.
More interestingly, the strength in hiring runs counter to sluggish economic growth. Output per worker has been anemic. The ‘workweek’ has not lengthened at all (little or no overtime). The result is uninspiring productivity growth and sluggish wages; both do not bode well for final demand. Employers will also be reluctant to continue hiring since the workers are not being productive. The recent improvement in employment, therefore, is not sustainable.
There are bright spots in the U.S. economy, namely housing and certain areas of technology, but they fail to pull up the rest of the economy. The U.S. is still stuck in a period of slow growth. The good news is that inflation has been very subdued because wage growth is minimal. Here are the details:
– The U.S. November nonfarm payrolls increased 211,000, cumulative revisions +35,000. Participation rate up from 62.4% to 62.5%, but U6 unemployment rate went up from 9.8% to 9.9%. (U3 is the official unemployment rate. U5 includes discouraged workers and all other marginally attached workers. U6 adds on those workers who are part-time purely for economic reasons.) The underlying quality of jobs is not great, a sign of slack in the labor market. The unemployment rate steady at 5.0%. “Average hourly earnings” only grew by 0.2%, after 0.4% gain in Oct; the y/y rate fell back to 2.3%. Wage pressure is very benign. The length of the workweek was unchanged; pipeline hiring pressure therefore is not great.
– U.S. manufacturing PMI (purchasing managers’ index) fell to 48.6 (signaling contraction), the lowest level since June 2009.
– U.S. Q3 GDP revised upward from 1.5% in the first estimate to 2.1%, mostly on larger inventories, which will be a drag on growth in Q4. Corporate profits fell 1.6%, after rising at 2.6% in Q2; they fell 4.7% y/y, the largest drop since Q2 of 2009. Consumer spending revised down from +3.2% to +3.0%. Personal income was revised up while investment in nonresidential structures fell 7.1%. Price deflator steady at 1.3%. Inflation is tame. Growth is not as strong as headline suggests.
– U.S. October durable goods report grew by 3.0%; core business capital spending increased by 1.3%, a rare reversal to the predominantly down trend.
– U.S. October personal income rose by 0.4%; spending increased by only 0.1%. Core price deflator steady at 1.3% y/y. Consumer confidence, however, fell sharply from 99.1 to 90.4.
– U.S. October existing home sales fell 3.4%; new home sales increased by 10.7%.
– U.S. core CPI increased by 0.2% in October; rising by 1.9% on a year-over-year basis.
– U.S. manufacturing production recovered in October, rising by 0.4%, after a 0.1% drop in September.
– U.S. Oct retail sales increased by only 0.1%; excluding autos, the growth was 0.2%.
– The Control Group (ex-autos, ex-gas stations, ex-building materials) climbed 0.2%, Sept was revised up from -0.1% to +0.1%. This is at best a mediocre report. Inside the U.S. Producer Price Index report, pipeline price pressures were absent. The PPI fell 0.4% in October; excluding food and energy it fell 0.3%; September was also down 0.3%.
The global picture is not rosy either. Japan just barely escaped recession. Canada, after being in recession for the first two quarters of 2015, saw GDP declining again in September, after positive growth for July and August. A sample of Canadian data is as follows:
– Canada lost 35,700 jobs in November. The unemployment rate rose from 7.0% to 7.1%, as the participation rate fell from 66.0% to 65.8%, a troubling combination.
– Canada imports also fell, by 0.8% .
– Canada September GDP fell 0.5%; after half decent July and August. Q3 overall +2.3%, y/y change is flat; slightly negative revisions to Q1 and Q2, which were both negative, putting Canada in recession for the first half of 2015.
– Canada September manufacturing sales fell 1.5%, after a decline of 0.2% in August. This will drag Q3 GDP lower. (Q1 and Q2 were negative).
– Canada September retail sales fell 0.5%, ex-autos also down by 0.5%. Core CPI steady at 2.1% year-over-year.
– Canada September GDP fell 0.5%; after half decent July and August. Q3 overall +2.3%, y/y change is flat; slightly negative revisions to Q1 and Q2, which were already both negative, putting Canada in recession for the first half of 2015.
China continues to go through a tough adjustment period on the way from an infrastructure and export-led growth model to a consumer-based economy. Excess capacity is everywhere. PPI (producer price index), a measure of prices of intermediate goods (bags of cement, rolls of steel etc), has fallen 45 consecutive months. China is now exporting aluminium, steel and energy products at an increasing rate, dumping into a global glut.
Electricity consumption and volume by rail have been falling. To try to restart the economy, the Peoples’ Bank of China is broadly expected to engineer a series of Yuan devaluations to stimulate exports and attract capital inflows. The economy is lumbering along under a crushing debt load. Private and public sector debt now account for over 250% of GDP.
– China Oct Consumer price index ticked up by 1.3%, much slower than +1.6% in Sept. The Producer Price Index (PPI) fell 5.9%, same as the 5.9% decline in Sept. This marked the 44th consecutive month of decline in the PPI, an unambiguous price of evidence for overcapacity. At the same time, ‘new property construction’ fell 13.9% year-to-date.
– China October railway cargo volume fell by 16.3% on a year-over-year basis.
– China manufacturing stuck in contraction mode. PMI at 48.6 (last 48.3).
Imports for China, Japan and the U.S. have been declining for the past few months. It is even more glaring for the U.S., since the U.S. Dollar has been strong. Declining imports do not spell well for domestic demand.
– Euro zone Q3 GDP up by 0.3%, a tad lighter than the 0.4% increase in Q2; y/y growth rate is 1.6%.
– EU business and consumer surveys are both a tad stronger.
– German October imports +3.4% m/m, exports -1.2% m/m; another disturbing data point on global trade and demand.
Monetary Policy Outlook
The vast majority of observers are now expecting the Federal Reserve to raise the Fed funds rate at the December 15/16 FOMC meeting. As the date draws near, conditions are becoming less friendly for a hike. While few manage to point out the internal inconsistencies in the job report, most are aware of the rising tensions in the commodities (crude oil, iron ore), currencies (Chinese Yuan, South African Rand and Indian Rupee) and credit markets.
Equities are beginning to feel the pressure as well. The overall environment does argue against a tightening move from the central bank given these issues surrounding growth and the general well-being of the global economy, despite the ‘normalization’ argument.
On the inflation front, ‘core PCE (Personal Consumption Expenditure) price deflator’ (the Fed’s favourite inflation gauge) is still running at 1.3% per annum, well below the Fed’s inflation target of 2.0%. There is a prevalent argument that rising healthcare costs will drive up core inflation in 2016, but such costs behave similarly to high energy costs in the past; they displace discretionary income and lower consumer demand, eventually slowing down the economy and general price levels.
The Bank of Canada and the European Central Bank are both taking a wait-and-see attitude.
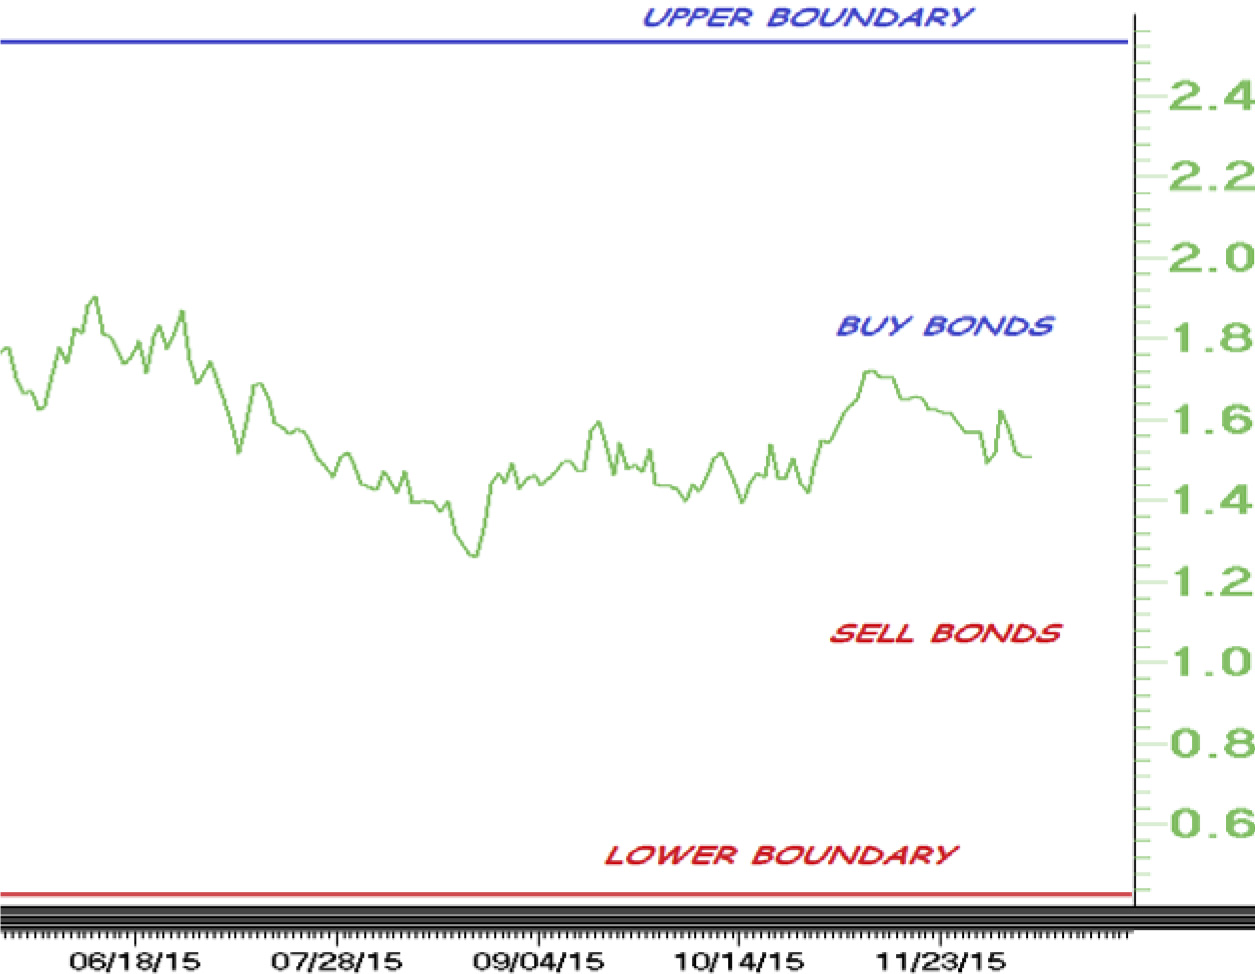
“Natural Boundaries of Interest Rates”
Macroeconomic data in Canada are pointing to real GDP growth of close to zero. The negative impact from falling energy prices is still being felt as some have lagging characteristics. Take the September GDP report, for example; energy-related supporting services fell 13% in September alone. Core inflation is steady at 1.5%, but does have the potential to drift lower.
The “Natural Boundaries” of the Government of Canada 10-year bond yield should be 0.50% to 2.5%, given a gross GDP of approximately 1.5%
Bond Strategy
China, the Emerging Markets, falling commodities prices and tensions in the credit markets all combine to provide a favourable backdrop for safe havens like U.S. and Canadian government bonds. A determined Fed and savoury data among a challenging macro environment is a recipe for lower bond yields in the longer end of the curve/higher bond prices.
We will be looking for opportunities to accumulate Government of Canada bonds within the context of the “Natural Boundaries of Interest Rates” (chart on previous page), looking for capital gains if and when bond yields fall towards the lower boundary by dominant macroeconomic forces.
20151210_CaldwellBondStrategyUpdate